Satellite Tracker APIs: Orbits, Predictions, and Passes
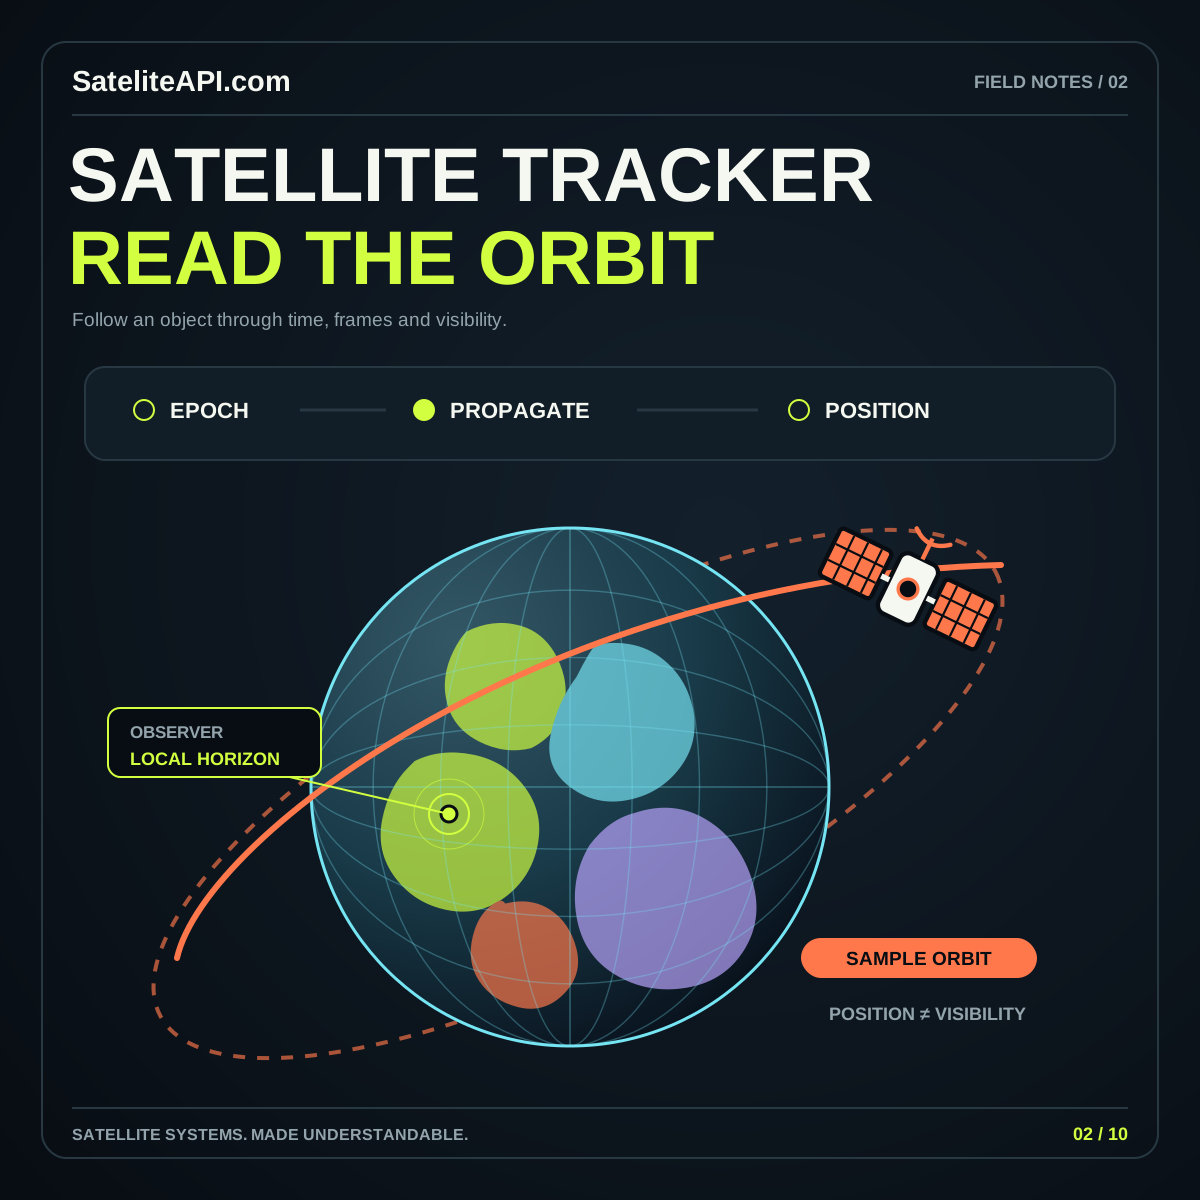
Learn how orbital records become position estimates and observer passes, why data age matters, and which details a trustworthy satellite tracking interface should display.
Read the guideFollow a satellite from its orbital record to a place on the screen. Learn how time, source information, and the observer’s viewpoint shape a useful tracking experience, then explore the ideas in your browser.
A tracker becomes more useful when its moving marker has an explanation. CelesTrak’s SGP4 tutorial connects GP orbital data with a compatible propagation model. Use that distinction to separate a source record from a calculated position. This learning path introduces the inputs, display choices, and questions that help readers interpret a satellite’s estimated motion.
Keep the object identifier, record source, and reference epoch together. A readable name helps a person navigate, while documented identifiers help your application select the intended object consistently when loading or comparing orbital information.
The observer’s location belongs beside any local sky view. Skyfield’s satellite documentation demonstrates positions and observer-based events. Decide whether the screen explains global motion, a ground track, or a local pass before adding its controls.
Give the selected display time a prominent place. Distinguish it from record and retrieval times. Readers should understand whether they are viewing an illustrative sequence, a model prediction, or another specifically identified kind of result.
Begin with one object or illustrative orbit. Write down what every displayed value means, and keep the selected object visible while the reader changes time or viewpoint.
Explore how a chosen time or observer location changes the interpretation. Compare the visual with its text explanation before introducing more objects, filters, or simultaneous animated paths.
Continue into orbital formats, propagation, and pass terminology. Use the full article to build a checklist for evaluating a tracking source or planning a more complete implementation.
A smoothly animated marker can come from illustrative geometry or a mathematical prediction. Label the actual basis of the display. Add source and time context before using language that implies live observations or a particular level of accuracy.
Identify its data source, selected time, orbital record epoch, and calculation approach. Explain what its marker represents. Clear context lets a reader inspect the result instead of judging it by animation alone.
Treat a geometric pass and viewing conditions as separate questions. Check the chosen tool’s documented assumptions and included conditions before interpreting a pass label as a promise of visible satellite observation.
Learn how orbital records become position estimates and observer passes, why data age matters, and which details a trustworthy satellite tracking interface should display.
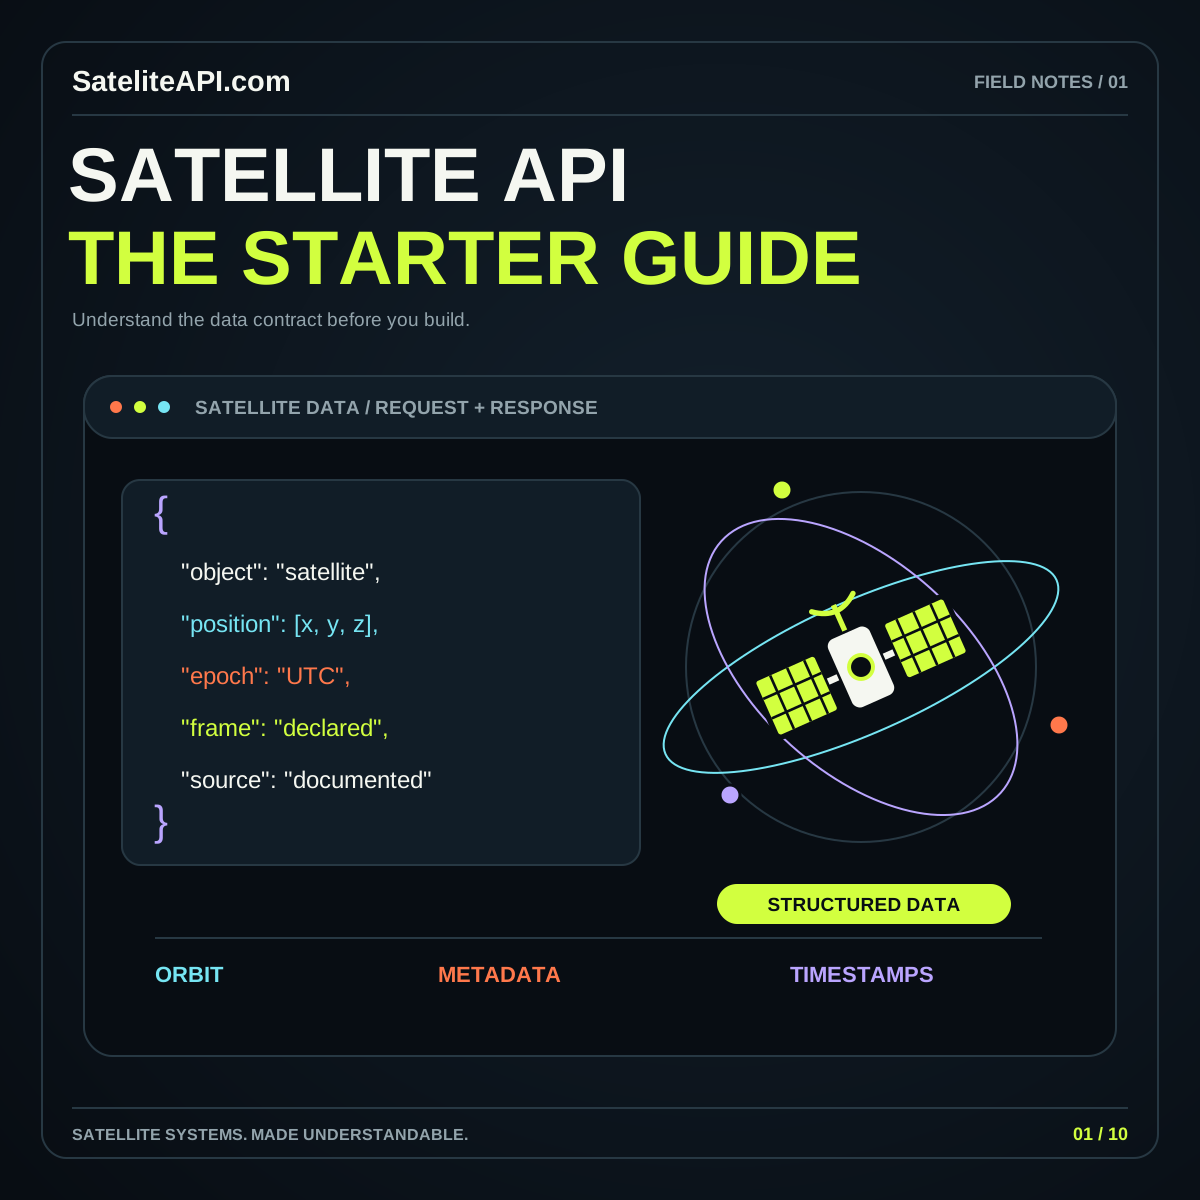
Read the guideA practical starting point for satellite APIs: understand the data families, ask better provider questions, and turn a promising sample response into a useful application.
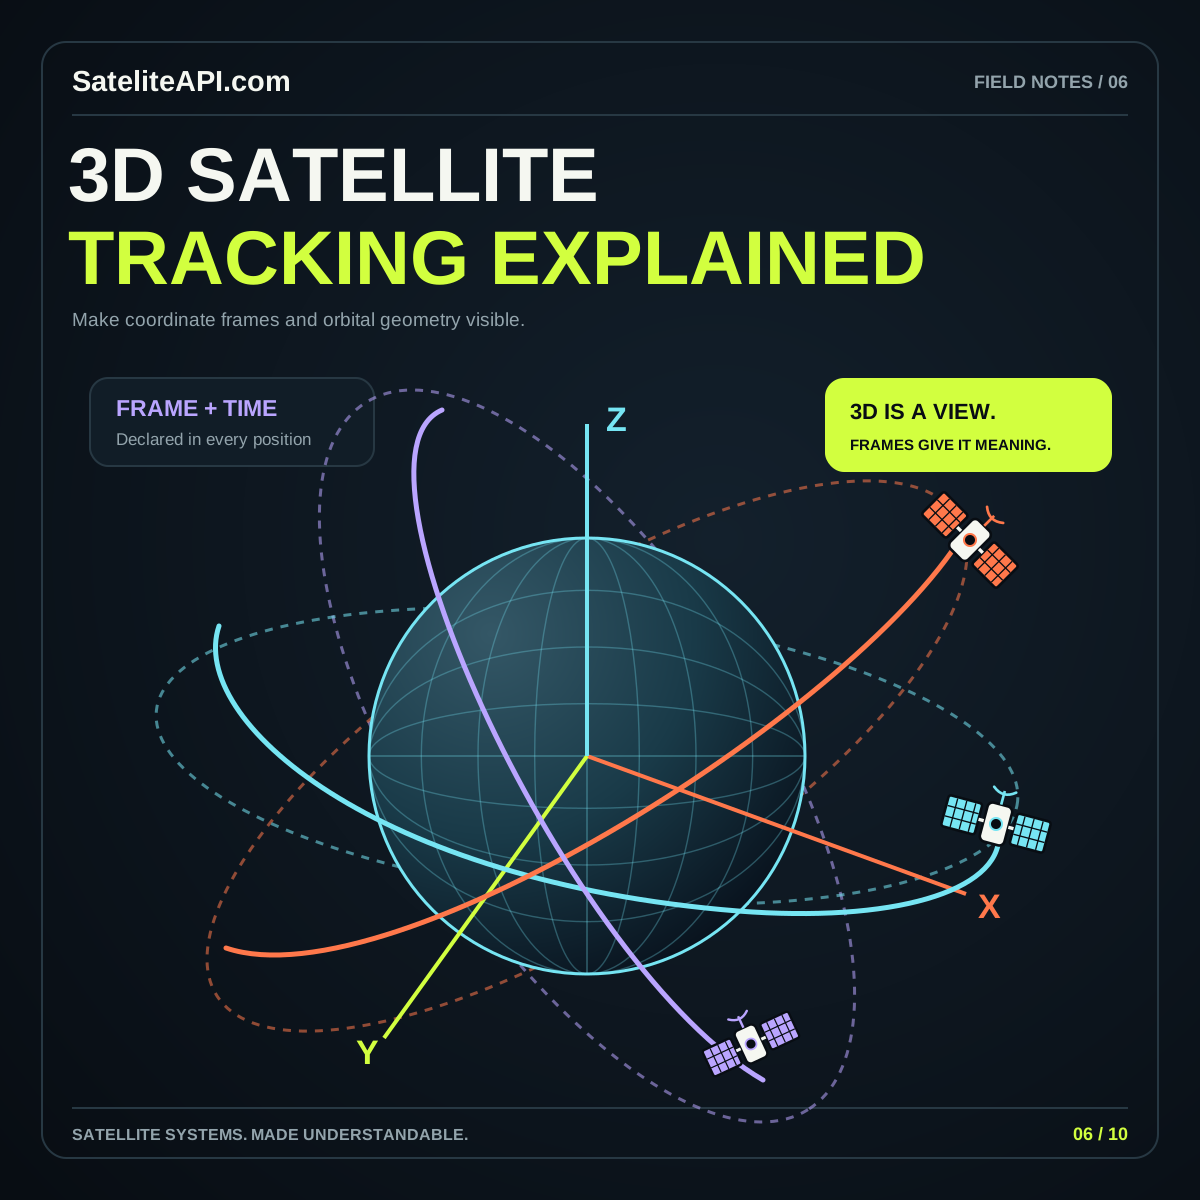
Read the guideA compelling 3D globe starts with a consistent model of Earth, position and time. Learn how to distinguish visual effects from the calculations that make satellite tracking useful.
Read the guide